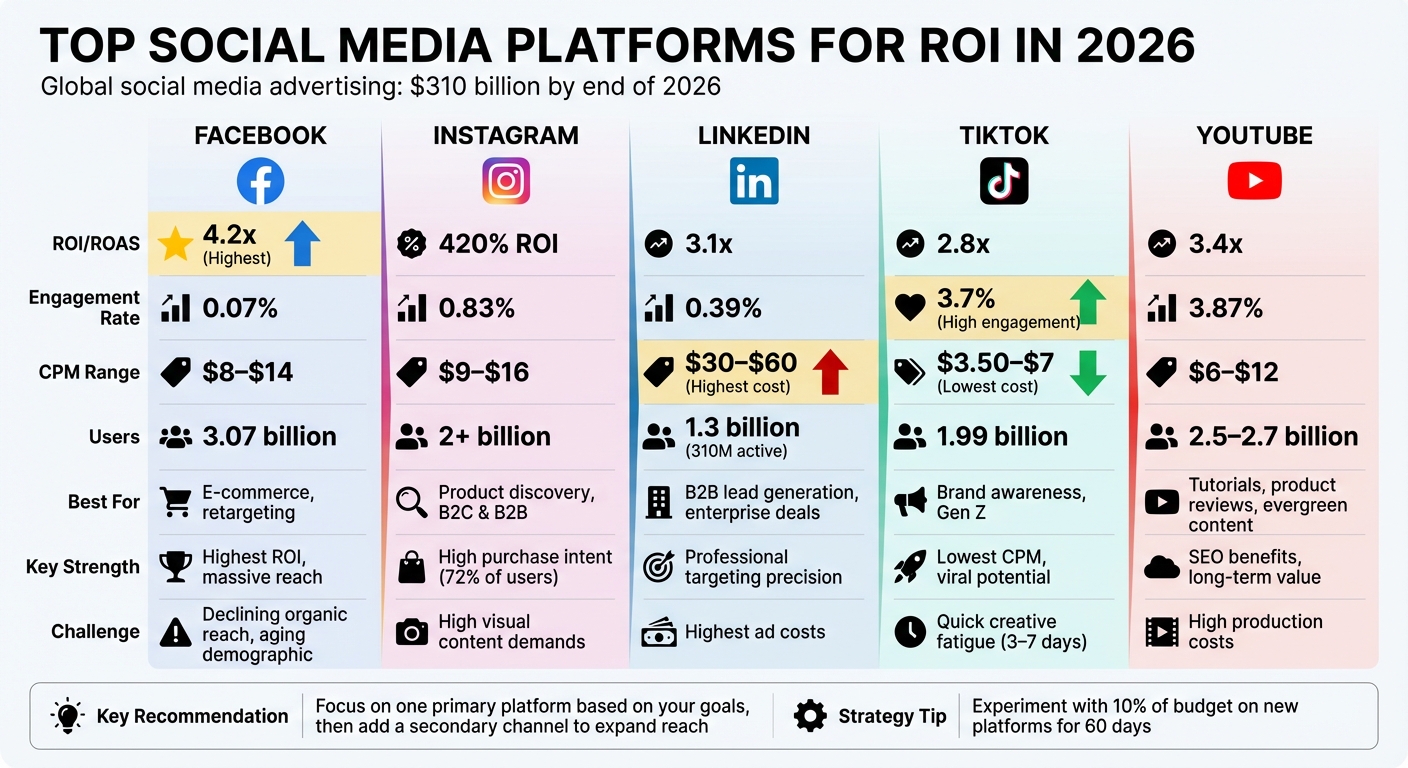
Social media advertising is expected to hit $310 billion globally by the end of 2026. Choosing the right platform can make or break your ROI, as returns vary significantly across channels. Here’s the breakdown:
- Facebook: Highest ROI (4.2x), ideal for e-commerce and retargeting with massive reach (3.07 billion users). Best for high-intent buyers but struggles with declining organic reach.
- Instagram: Delivers 420% ROI, excelling in product discovery through Reels and Stories. Strong for both B2C and B2B but requires high-quality visuals.
- LinkedIn: Dominates B2B with a 3.1x ROI for lead generation. High costs but unmatched for targeting decision-makers and securing high-ticket deals.
- TikTok: Budget-friendly with the lowest CPM ($3.50) and 3.7% engagement rate. Great for brand awareness and younger audiences but requires frequent content updates.
- YouTube: Offers 3.4x ROI with long-term value from evergreen content. Best for tutorials, product reviews, and search-driven campaigns but demands higher production costs.
Quick Comparison
| Platform | ROI/ROAS | Engagement Rate | CPM Range | Best For | Challenges |
|---|---|---|---|---|---|
| 4.2x | 0.07% | $8–$14 | E-commerce, retargeting | Aging demographic, low organic reach | |
| 420% ROI | 0.83% | $9–$16 | Product discovery, B2C & B2B | High visual content demands | |
| 3.1x | 0.39% | $30–$60 | B2B lead generation | High ad costs | |
| TikTok | 2.8x | 3.7% | $3.50–$7 | Brand awareness, Gen Z | Quick creative fatigue |
| YouTube | 3.4x | 3.87% | $6–$12 | Tutorials, product reviews | High production costs |
Focus on one primary platform based on your goals, then add a secondary channel to expand reach. For instance, use TikTok for awareness and retarget on Facebook. Experiment with 10% of your budget on new platforms or formats for 60 days to refine your strategy.
Social Media Platform ROI Comparison 2026: Facebook, Instagram, LinkedIn, TikTok, YouTube
1. Facebook
Average ROI
Facebook continues to lead as a top-performing platform for businesses in 2026. Globally, 28% of marketers rank it as their highest-ROI platform, surpassing Instagram (22%) and YouTube (12%). Advertisers on Facebook see results that align with Meta‘s overall performance metrics. For instance, e-commerce campaigns achieve an average return on ad spend (ROAS) of 2.8x, while lead generation campaigns boast conversion rates of 7.4%. AI-driven automation has further enhanced these outcomes. Meta‘s Advantage+ Shopping Campaigns deliver 12–25% higher ROAS compared to manual campaigns, with 82% of Facebook advertisers now utilizing these AI tools. A notable example from early 2026 involves ShortVids managing Meta Ads for Gene Slade, turning a $2,000–$3,000 monthly ad spend into $10,000–$12,000 in revenue – a 4–5x ROI – while generating 20–30 qualified leads daily.
Audience Reach
Facebook’s impressive ROI is matched by its unparalleled audience reach. With 3.07 billion monthly active users and 2.11 billion daily active users, it remains the largest social network globally, offering access to a multi-generational audience. Millennials, particularly those aged 25–34, make up the largest demographic, but the platform also enjoys an 88% usage rate among Gen X and Baby Boomers. Notably, users aged 65 and older represent the fastest-growing segment, with a 15% year-over-year increase, logging in an average of nine times daily.
This diverse audience translates into significant purchasing power. Nearly 39% of users turn to Facebook when they’re ready to make a purchase, and its potential ad reach spans 2.28 billion users, offering businesses access to a vast pool of high-intent buyers. Geographically, India leads with 383.5 million users, followed by the United States at 196.9 million.
Ideal Use Cases
Facebook’s extensive user engagement and demographic reach make it an ideal platform for capturing and converting high-intent buyers. Its tools, such as Advantage+ Shopping Campaigns and Facebook Shops, enable e-commerce brands to leverage robust social commerce channels effectively. For example, in 2025, Lovepop streamlined their ad sets and implemented Campaign Budget Optimization, leading to a 29% boost in ROAS and a 25% reduction in costs within just 30 days.
Retargeting campaigns also shine on Facebook, driving exceptional results. Aurum Brothers achieved a 13x ROI by targeting past website visitors, while KLM Royal Dutch Airlines saw an 87% increase in conversion rates using dynamic ads for remarketing compared to standard campaigns. Additionally, 22% of B2B marketers consider Facebook their top platform for driving business outcomes, particularly for thought leadership initiatives and reaching high-value buyers.
sbb-itb-7a4ada9
2. Instagram
Average ROI
Instagram has proven itself as a powerhouse for marketing campaigns, offering an average 420% ROI by 2026, making it a top choice for businesses looking to maximize profits. The beauty industry stands out with an impressive 518% ROI from Instagram ads, while the platform’s 1.6% conversion rate surpasses Facebook’s 1.1%. The shift from hashtag-based discovery to AI-driven content recommendations – focused on watch time and shared content – has redefined how brands connect with potential customers.
Reels have emerged as the go-to format, achieving an average reach rate of 30.81%, which is more than double the 13.14% reach of static images. Notably, 55% of Reel views come from non-followers, offering brands a chance to reach audiences beyond their existing followers. For B2B marketers, Instagram is surprisingly efficient, with an average cost-per-lead of $49, making it a cost-effective option for lead generation.
Engagement Rates
The 2026 Instagram algorithm emphasizes active engagement – saves, shares, and DM sends – over passive actions like likes. These behaviors indicate higher user intent and help extend content reach. As Instagram CEO Adam Mosseri explains:
"Watch time is the primary factor, with users deciding within 1.7 seconds whether to continue watching".
Reels drive engagement rates between 1.23% and 2.08%, while carousels maintain a steady 0.55% engagement rate. The "save" feature has become increasingly important, carrying the same weight as likes and comments because it shows users find the content valuable enough to revisit. With 694,000 Reels shared via DM every minute, direct messages have become a powerful tool for expanding audience reach.
Audience Reach
Instagram’s audience continues to grow, with over 2 billion monthly users worldwide and 65% of social media users actively maintaining profiles. What sets Instagram apart is user intent: more than 25% of users visit the platform specifically to discover new products or make purchasing decisions. Additionally, 60% of users interact with brands multiple times a week, creating frequent opportunities for businesses to engage.
Instagram is also proving effective for B2B marketing. Despite having smaller audiences compared to B2C, B2B brands experience 20 times more engagement on Instagram than on LinkedIn, with 22.53 interactions per 1,000 followers compared to LinkedIn’s 1.98. A standout example is Microsoft Teams, which adopted a B2C-style approach with empathy-driven and behind-the-scenes content, resulting in a 38% follower increase and 28% higher engagement compared to their more corporate-style posts. This broad audience reach reinforces Instagram’s value as a key marketing tool in 2026.
Ideal Use Cases
Instagram’s high ROI and engagement make it a powerful full-funnel commerce platform, where discovery and purchase happen seamlessly. Features like AR try-ons, live shopping, and one-click checkouts streamline the buying process. Stories remain a favorite for businesses, accounting for 72% of brand posts, making them ideal for maintaining daily engagement and nurturing existing audiences. Many brands follow a 50/30/20 content strategy: 50% Reels for reach, 30% feed posts for education, and 20% Stories for community building.
The platform is also a growing hub for customer service. Automated DM sequences and quick-reply templates allow businesses to handle support and lead qualification efficiently. As Roxy Hulyk, Account Director of Influencer Marketing at Acceleration Partners, puts it:
"Instagram is a highly visual platform, making it ideal for businesses to showcase products and services creatively in their own voice or through influencers and brand loyalists".
3. LinkedIn
Average ROI
LinkedIn stands out in the B2B marketing arena, delivering an average ROI of over 200% for lead generation campaigns. This outpaces Facebook’s 150% and Instagram’s 100-120% in business-to-business settings. The platform also boasts a median ROAS of 1.8x, beating Google Ads’ 1.25x, and offers a 44% higher revenue return per dollar spent. For niche B2B lead generation, LinkedIn can achieve up to 4.1x ROI.
One of LinkedIn’s key advantages is the quality of deals it facilitates. On average, contract values are 28.6% higher, while engaging key accounts costs significantly less – $257 on LinkedIn compared to $560 on Google. Marketing strategist Chuck McKay highlights this advantage:
"When you’re selling high-value services or solutions with long sales cycles, LinkedIn’s ability to reach decision-makers makes the premium ad costs worthwhile".
Reflecting this success, B2B digital marketing budgets have shifted, with LinkedIn’s share rising from 31.3% to 37.6%.
Engagement Rates
LinkedIn’s engagement metrics have seen a sharp rise, with the average engagement rate reaching 3.85% in 2026, a 44% year-over-year increase. This growth underscores its effectiveness in connecting with decision-makers. Among content types, carousel posts perform best, achieving a 6.60% engagement rate, while video content averages 4.7%. The platform’s algorithm now emphasizes "dwell time", prioritizing content that holds a user’s attention over simple reactions.
Interestingly, personal profiles generate three times the engagement of company pages. Employee-generated content performs exceptionally well, reaching 561% further than company posts, making employee advocacy a pivotal strategy. Thought Leader Ads, which amplify employee posts, achieve click-through rates of 1.18% for top performers while being cost-effective at $2.29 per click compared to $13.23 for single image ads.
Audience Reach
LinkedIn’s membership has grown to over 1.3 billion, with 310 million monthly active users as of 2026. Even more compelling, 4 out of 5 members influence business decisions, providing advertisers direct access to key organizational players. The platform generates 80% of all B2B social media leads, with Lead Gen Forms converting at an impressive 13% rate, over five times the industry average.
The platform’s audience quality is another standout feature. In the U.S., 44% of users earn over $75,000 annually, and 51% hold college degrees. LinkedIn ads are particularly effective for reaching senior decision-makers, with 52.3% of marketers reporting higher seniority in LinkedIn leads compared to other platforms. Exposure to LinkedIn ads has been shown to increase purchase intent by 33% and boost conversion rates by 6x. This makes LinkedIn perfect for targeting high-value audiences with precision campaigns.
Ideal Use Cases
LinkedIn is a powerhouse for high-value enterprise deals exceeding $10,000, thanks to its ability to target specific job titles, seniority levels, and company sizes. It’s especially effective for industries like SaaS, technology, professional services, and finance, where credibility and precision targeting are key.
Success today hinges on creating hyper-specific, industry-focused content. An 80/20 mix of tactical frameworks and personal stories has been shown to drive a 61% higher conversion rate on paid ads. Combining organic and paid LinkedIn strategies is now essential. With the launch of LinkedIn’s native CRM integration in June 2025, marketers can now track ROI seamlessly – from the first click to a closed deal – directly within Campaign Manager.
4. TikTok
Average ROI
TikTok stands out as a budget-friendly platform with strong potential for ROI and user engagement. While its 2.8x ROAS trails Meta’s 4.2x and LinkedIn’s 3.1x, TikTok offers the lowest CPM, ranging from $3.50 to $9.16. This makes it an excellent choice for campaigns focused on reach and brand awareness.
The TikTok Shop integration is a game changer. Brands using TikTok’s in-app checkout see 35–55% higher conversion rates compared to those directing users to external sites. Additionally, 51% of small business owners report positive ROI from TikTok ads, and 56% of U.S. consumers have purchased items promoted on the platform. With TikTok Shop sales projected to hit $20 billion by 2026, the platform’s affordability and effectiveness make it a smart investment.
Engagement Rates
Engagement is where TikTok truly shines, boasting an average engagement rate of 3.70%, which is nearly 8x higher than Instagram’s 0.48%. Over the past year, engagement has grown by 49%, and smaller accounts (those with fewer than 5,000 followers) often see rates as high as 4.20%.
TikTok’s algorithm values shares and saves over likes, focusing on content that resonates deeply with users. In 2025, shares per post increased by 45% year-over-year, emphasizing the importance of creating content that connects on a personal level. Native-style videos – casual, vertical, and shot on smartphones – perform best, as polished ads tend to see 50–70% lower engagement. The platform’s algorithm also rewards engagement velocity, meaning the first few minutes after posting are critical for achieving wider reach.
Audience Reach
TikTok’s audience is massive, with 1.99 billion monthly active users as of early 2026. Users spend an average of 1 hour and 37 minutes daily on the app, offering brands significant exposure. The platform is particularly popular among younger demographics, with 68% of its audience under 35 years old.
What sets TikTok apart is its growing role as a search engine for product discovery. A notable 49% of Gen Z consumers use TikTok to research products, often before turning to Google. As Morgane Wasilewski, Social Media Manager at Channable, puts it:
"On TikTok, people don’t just scroll for inspiration. They actively look for answers… users are increasingly going straight to TikTok instead of Google".
This behavior translates into sales, with 43.8% of TikTok users making purchases after seeing a product on the platform. TikTok Shop affiliate links boast a 5.2% conversion rate, and content from micro-influencers can achieve rates as high as 30.1%.
Ideal Use Cases
TikTok thrives in areas like product discovery, tutorials, authentic reviews, and entertainment-focused commerce. Beauty and skincare brands perform particularly well, accounting for 79.3% of TikTok Shop purchases. Fashion brands benefit from try-on hauls and styling tips, while home and lifestyle products excel with organization hacks and problem-solving demos.
Even B2B marketing is gaining momentum on TikTok. 42% of Gen Z and Millennials follow B2B creators for professional insights and industry tips. To succeed, brands must hook viewers quickly – 71% of watch time is determined in the first three seconds. Leading with curiosity or humor is far more effective than starting with a logo.
To combat creative fatigue – common in high-spend campaigns after 3–7 days – brands should test 5–8 creative variations per campaign and refresh them weekly. Partnering with micro-influencers (10K–100K followers) can also boost engagement, as they achieve rates of 8.2%, compared to 5.3% for macro-influencers.
5. YouTube
Average ROI
YouTube delivers a ROAS of 3.4x, placing it between Meta’s 4.2x and TikTok’s 2.8x ROAS. Its dual identity as a social platform and the second-largest search engine in the world makes it a powerful tool for businesses targeting users actively searching for products. In fact, 70% of people report purchasing a product after seeing a YouTube ad. On a global scale, YouTube is the third-highest ROI-generating social channel, with 12% of marketers naming it their top performer [51, 3]. It also outshines other platforms by being 1.6x more likely to influence purchase decisions. Shopify merchants, for example, see an average ROAS of $5.20 for every $1 spent, with some campaigns exceeding $15. Advertisers can anticipate CPM rates ranging from $6 to $12 and CPC averages of $0.30 to $1.20. These numbers highlight the platform’s ability to deliver consistent returns, supported by its strong engagement and extensive reach.
Engagement Rates
YouTube boasts an average engagement rate of 3.87%, comparable to TikTok’s performance. Its YouTube Shorts feature has exploded in popularity, generating over 70 billion daily views globally as of early 2026. Shorts also achieve an impressive 31% average view-through rate, making them a great tool for brand discovery. Additionally, well-optimized videos on the platform can drive long-term leads and revenue. Users spend an average of 49 to 85 minutes daily on YouTube [64, 14], and for Connected TV, ad completion rates exceed 95%. This combination of high engagement and retention ensures that YouTube remains a top choice for advertisers.
Audience Reach
With 2.5 to 2.7 billion monthly users, YouTube’s reach is unmatched [51, 49, 50]. Its advertising reach extends even further to 3.35 billion users. In the U.S., YouTube connects with 84% of all adults [51, 49], including 93% of internet users aged 18–49. It also reaches 89% of U.S. households earning over $100,000 annually. The platform spans all generations, maintaining strong engagement among 18–24-year-olds while also appealing to older demographics. Its gender split is nearly even, with 53–54.4% male and 46–47% female users [64, 65, 14]. Notably, 49% of Gen Z consumers now turn to YouTube for product discovery before using traditional search engines. U.S. viewers also rank YouTube as the top source for shopping-related content, especially for instructional videos (91%), product reviews (81%), and unboxing experiences (76%) [14, 49].
Ideal Use Cases
YouTube’s unique combination of search capabilities and visual content makes it ideal for brands focusing on tutorials, product reviews, and educational videos. Data shows that users are 3x more likely to watch a tutorial than read instructions, making how-to content particularly effective. Tutorial-style videos perform 5x better than purely promotional ones. The platform supports full-funnel marketing strategies: Shorts can drive initial reach, while long-form videos provide in-depth demonstrations, boosting conversion rates by 3x compared to short-form content alone.
Brands have seen impressive results by leveraging YouTube’s strengths. For instance, in 2025, Ambari Nutrition partnered with influencers to create educational content tailored for bariatric and diabetic patients. This led to a 300% revenue increase and conversion rates 40% higher than average. Similarly, Electcomm Group Electrical & Data achieved an 18% conversion rate – nearly 3x higher than on other platforms – by offering technical insights and giving creators creative freedom. As Director Caspar Matthews noted:
"Giving our partners creative freedom has been a game-changer. The content resonated with our audience and boosted our conversion rate to 18 percent on YouTube. This is almost three times the amount compared to other platforms."
For B2B and high-ticket sales, YouTube’s search-driven nature is especially effective in reaching decision-makers actively researching solutions. Optimizing videos with SEO-friendly titles, descriptions, and tags is essential. And since over 70% of YouTube watch time happens on mobile devices, ensuring mobile-friendly content is non-negotiable.
How Social Media Algorithms Really Work in 2026 (And How to Win)
Strengths and Weaknesses
Every platform brings its own advantages and challenges, which directly impact ROI. Here’s a closer look at how these platforms perform and where they might fit into your campaign strategy.
Meta (Facebook + Instagram) stands out with the highest ROAS at 4.2x, thanks to advanced AI-driven targeting through Advantage+ campaigns. These campaigns can increase returns by 12–25% compared to manual management. On the downside, Facebook’s organic reach has dropped significantly, and its audience tends to skew older. Instagram, on the other hand, excels at driving purchase intent – 72% of users make buying decisions on the platform. However, its focus on high-quality visuals can stretch production budgets.
LinkedIn is known for its precision in B2B marketing, although it comes with high costs – CPMs range from $30–$60, and CPCs fall between $6–$12. That said, LinkedIn delivers conversion rates that are twice as high as other platforms and is particularly effective for generating leads for high-ticket enterprise deals, especially those exceeding $10,000 in value.
TikTok offers the lowest CPMs ($3.50–$7) and leads in engagement with a rate of 5.96%. Its ads generate 155% more engagement than Facebook’s. The main challenge lies in creative fatigue – ads often lose their effectiveness within 3–7 days, requiring frequent updates. Additionally, ads that don’t align with TikTok’s native style can see performance drops of 50–70%.
YouTube delivers a solid 3.4x ROAS and benefits from evergreen content that continues to generate returns over time. However, creating YouTube ads often involves higher production costs and longer timelines compared to platforms like TikTok, which favor quicker turnarounds.
| Platform | ROAS/ROI | Engagement Rate | CPM Range | Primary Strength | Primary Weakness |
|---|---|---|---|---|---|
| 4.2x ROAS | 0.07% | $8–$14 | Massive reach & AI targeting | Aging demographic & low organic reach | |
| 100–120%+ ROI | 0.83% | $9–$16 | High purchase intent (72% of users) | High creative production demands | |
| 3.1x ROAS | 0.39% | $30–$60 | Professional targeting precision | Highest advertising costs | |
| TikTok | 2.8x ROAS | 5.96% | $3.50–$7 | Viral potential & lowest CPM | Quick creative fatigue (3–7 days) |
| YouTube | 3.4x ROAS | 0.52% | $6–$12 | SEO benefits & evergreen content | High video production requirements |
Conclusion
After examining the performance of various platforms, it’s evident that no single channel dominates across the board. The best return on investment (ROI) depends entirely on your business model, target audience, and specific goals. For instance, B2B companies often find LinkedIn worth the higher costs due to its professional focus, while eCommerce brands can take advantage of Meta’s sophisticated AI-driven targeting. TikTok stands out for engaging Gen Z with cost-effective awareness campaigns, and YouTube offers long-term value through evergreen content.
The real edge comes from strategically combining multiple platforms rather than relying on just one. Coordinated campaigns leverage the unique strengths of each channel to drive better overall results. For example, you can generate awareness through high-reach platforms like TikTok or YouTube and then retarget those audiences on Meta to drive conversions. This multi-platform approach creates a full-funnel system that maximizes your ad spend. Platforms like LinkedIn, with its professional targeting, and YouTube, with its lasting content, highlight the importance of aligning platform capabilities with your campaign objectives.
"In 2026, winning on social isn’t about being everywhere; it’s about choosing fewer platforms and executing with intent." – Talar Mazloumian, Content Marketing Manager, Later
To get started, focus on a primary platform to establish authority. From there, expand to one or two additional channels to broaden your reach. Dedicate 10% of your budget to experimenting with new platforms or creative formats for 60 days before scaling your efforts. Using multi-touch attribution models can also help ensure that upper-funnel platforms driving awareness receive proper credit.
FAQs
Which platform is best for my business goals in 2026?
The right platform for achieving your business goals in 2026 will depend heavily on your audience and objectives. Here’s a quick breakdown:
- Meta (Facebook, Instagram): These platforms deliver a solid return on investment, with an average return on ad spend (ROAS) of 4.2x, making them a go-to choice for many businesses.
- LinkedIn: While it tends to have higher costs, it’s an excellent option for B2B lead generation, especially if you’re targeting professionals or decision-makers.
- TikTok: If brand awareness is your priority, TikTok offers low cost-per-thousand-impressions (CPM), making it a budget-friendly way to reach a broad audience.
Your choice should align with your overall strategy and the specific market you’re targeting.
How should I split my budget across two platforms?
To make the most of your budget in 2026, concentrate on platforms that match your objectives and target audience. Consider dedicating 60–70% of your budget to platforms with a track record of delivering strong ROI, such as Meta (Facebook and Instagram). Allocate the remaining 30–40% to newer platforms like TikTok, which can help boost brand visibility and reach untapped audiences. This approach allows you to maximize returns while still exploring opportunities for growth. Adjust the allocation based on where your audience is most active and the type of content that resonates best with them.
How do I track ROI across multiple platforms?
To measure ROI effectively across various social media platforms, consider using a multi-touch attribution model. This approach recognizes the role of each platform in driving conversions and engagement, rather than putting all the credit on the final click. It’s a more balanced way to value user interactions throughout their journey.
Combine data from all platforms into a centralized analytics system. Keep an eye on key metrics like ROAS (Return on Ad Spend) and CPM (Cost Per Thousand Impressions). Regularly review and tweak your strategy based on these insights to ensure precise tracking and better ROI outcomes over time.


